


Exploring the changing trends in wine drinking in USA between 2010 and 2024 gives us an interesting peek into the world of consumer habits and the factors that have the greatest impact on the wine business. This article is going to analyze the consumption of liters per capita, total wine consumption and the factors driving these shifts.
Wine Consumption Trends: 2010 - 2024
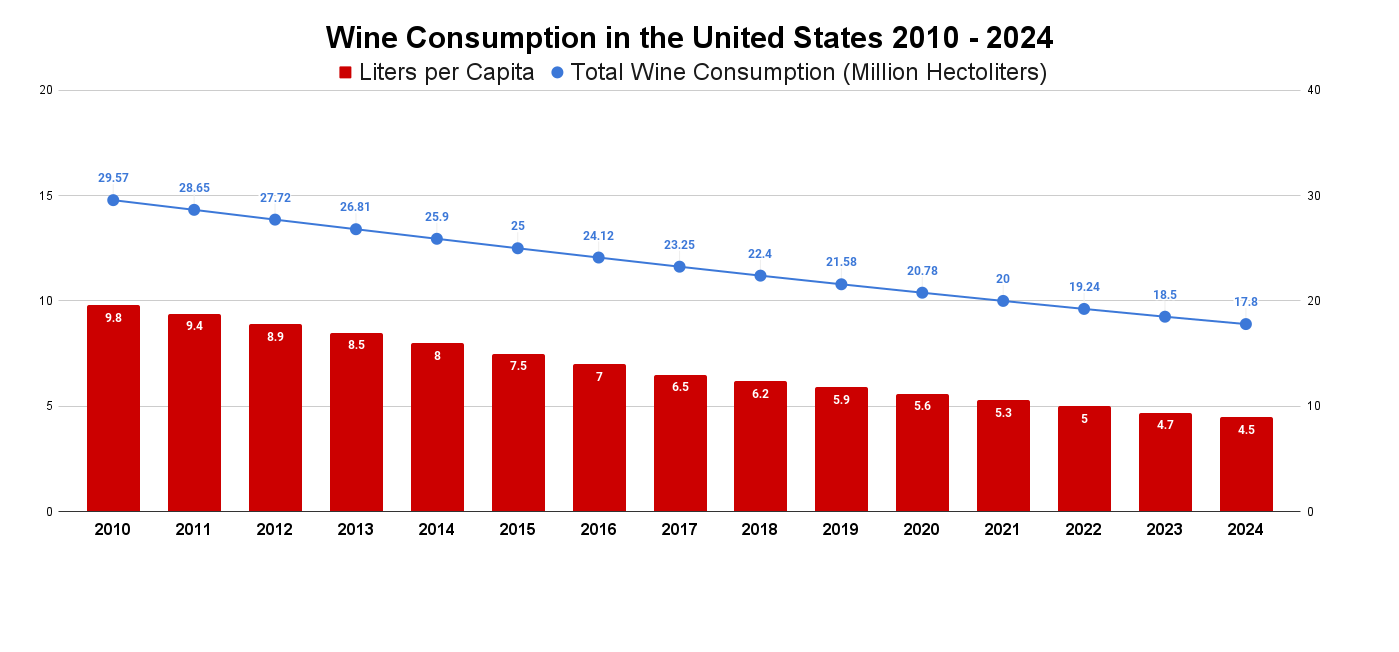
Liters Per Capita Consumption and Total Consumption
| Year | Liters per Capita | Total Wine Consumption (Million Liters) |
|---|---|---|
|
2010 |
9.8 |
29,570 |
|
2011 |
9.4 |
28,650 |
|
2012 |
8.9 |
27,720 |
|
2013 |
8.5 |
26,810 |
|
2014 |
8.0 |
25,900 |
|
2015 |
7.5 |
25,000 |
|
2016 |
7.0 |
24,120 |
|
2017 |
6.5 |
23,250 |
|
2018 |
6.2 |
22,400 |
|
2019 |
5.9 |
21,580 |
|
2020 |
5.6 |
20,780 |
|
2021 |
5.3 |
20,000 |
|
2022 |
5.0 |
19,240 |
|
2023 |
4.7 |
18,500 |
|
2024 |
4.5 |
17,800 |
Reasons for Yearly Changes in Consumption
The changes in wine consumption in the United States are influenced by various factors:
- Economic Fluctuations: The economy influences the consumer spending. Under financial strain, individual consumers often prefer cheaper drinks, hence less wine is consumed as result.
- Cultural Trends: Life-style transformations and health issues shape consumers’ tastes in wine. Enhanced public health awareness can lead to the choice of lower-alcoholic or non-alcoholic drinks among consumers, therefore altering the traditional wine consumption habits.
- Weather and Harvest Variability: Weather conditions are among the key variables that affect the harvest of grapes. Adverse weather can restrain manufacture, provoking the beer accessibility and consumption levels to falter.
- Competition from Alternatives: Competition of other drinks, like craft beer or liquor, can take away attention of the wine.
- Marketing and Innovation: Marketing campaigns and fashion trends, especially the emerging ones, influence the way people think and behave. The presence of successful branding campaigns and new product launches can increase wine consumption as well.
FAQ
-
What distinguished the US wine consumption patterns of the year 2023 from previous years??
In 2023, the average American consumed 4.7 liters of wine, and total wine consumption for the year was 18,500 million liters.
-
What is the estimated wine consumption of the United States by the year 2024?
Bearing in mind the ongoing trends, the U.S. wine consumption is predicted to remain in the same state in 2024 with the per capita consumption expected to be at 4.5 liters and the total consumption estimated to be 17,800 million liters.
-
How do economic ups and downs influence the wine demand?
The degree and direction of economic conditions powerfully influence wine consumption. Consequently, during economic turmoil consumers will look for cheaper goods making wine sales go down.
-
How does the impact of cultural shifts affect the changes in wine consumption?
Cultural shifts create a fundamental effect on the wine intake pattern. Moreover, the increase of health-consciousness makes people favouring low alcohol and non-alcoholic beverages, consequently changing the traditional way of wine drinking habits.
-
What marketing strategies affect wine consumption and how?
Marketing strategies having a great power over wine drinking trends development. Successful marketing campaigns often generate significant curiosity and demand from wine.
Conclusion
The evolution of U.S. wine consumption between 2010 to 2024 vividly shows the complexity of the economic, cultural and market factors. As the American wine industry adapts to people’s changing taste and external influences, it retains its uniquely important position of the nation’s food culture and heritage.


Highly recommend 🍇